I’ve been writing several blog posts recently that describe
EMC’s use of analytics to accelerate the innovation that is coming
from global university research partners world-wide.
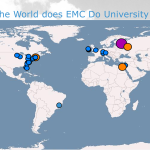
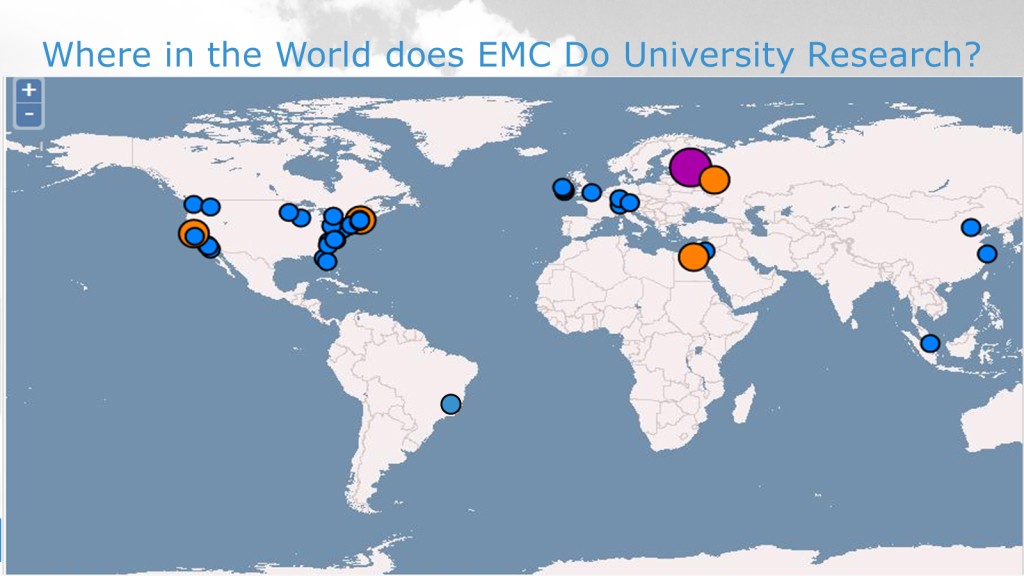
The geographic locations of many (but not all) of our
university research partners are depicted below:

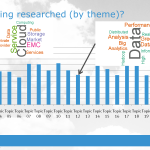
In addition, in my last post I described how EMC tries to
keep track of “what” research activities our global partners are working on
through the use of Stanford’s Topic Modeling Toolbox:

In this post I’d like to shed a little more light on how to take these research themes and map them to specific geographic regions. In
order to do this, it helps to describe the inner workings of EMC's innovation analytics framework in general.
The framework is founded upon activities that are closely tied to innovation, including:
- University Research
- Publications
- Conferences
- Customers/Partner engagements
- Knowledge Transfer/Brown Bag sessions
- Employee ideas
- Intellectual property
- Etc.
Visually these activities can be depicted as follows:

The analytic framework is essentially a data gathering
process that can record these activities via a variety of methods, including (a) manually, (b) via email, (c) via crawling of a file
system, or (d) as part of Outlook calendar invites. No matter what the source of
ingest, all of the innovation activities (including university research), are funneled into an analytic sandbox, which stores both structured and
unstructured content (the graphic below describes this approach, and was previously described in a series of posts on
the data analytic lifecycle).

The beauty of this approach is that the geographic location
of the structured and unstructured data is preserved during the ingest phase,
and thus available for analytic queries. For example, the diagram below
highlights an answer to the question: “What types of research has EMC funded
recently in Russia”?

The resulting map and word cloud depicts that
compression research is occurring in Saint Petersburg, Russia. This is due in large part to the strong
mathematical skills of the EMC employees and universities in that region.
I recently contributed an article that described my own
personal empirical data about innovation at our global R&D locations. The
approach described above is an alternative, data-driven approach to classifying a company's global innovation activities.
Who are the EMC employees conducting the research? Can
the analytic framework drill down to the employee level and discover which EMC mathematicians
are involved with this compression collaboration, and/or which Russian
employees participate in university research in general?
The answer is yes, and more detail will be described in an
upcoming post.
Steve
EMC Fellow