Today I attended EMC’s 2nd Annual University Day
in Santa Clara, California. A large
number of schools were represented from all over the United States, including:
- UC San Diego
- UC Irvine
- UC Santa Cruz
- Northeastern University
- Minnesota
- Carnegie Mellon University
- University of Wisconsin
- Case Western
- Florida International University
- University of Utah
- Harvard
- University of Rochester
- Stony Brook University
- Princeton University
The
agenda for the day included discussions on challenging high-tech issues in
next generation data centers, including new developments in solid state storage. EMC Distinguished Engineer Jeroen
VanRotterdam led an interesting dialogue examining the current state of relationships
between Industry and Academia.
Greg
Ganger, CMU Professor and Director of the Parallel Data Lab, gave the Academic
Keynote during the afternoon session. His keynote was followed by the annual
poster session, in which nine students competed for first prize.
For
this post, however, I’d like to summarize a discussion I led just before lunch, in
which I asked the students the following question:
“How
would you manage EMC’s global university research portfolio?”
Their answer was loud and clear: "We don't know!". I responded that the answer was a fair one; it's a hard problem to solve. I then shared our company's approach of using EMC’s
own analytic products (e.g. Pivotal/Greenplum) to perform global analytics
across all academic research partners.
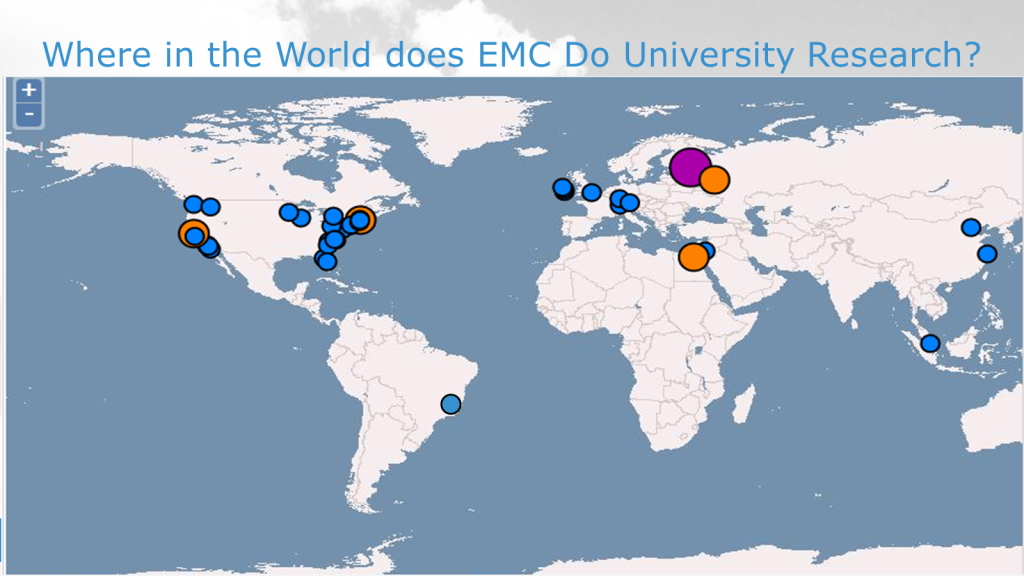
In order to highlight the global span and scope of our research
initiatives, I shared the following map:

This
map is dynamically generated. While it doesn’t represent every university
research partnership EMC has across the globe, it’s pretty close. The map is the result of nearly two years of
collaboration across all of the countries that register their research engagements. The larger the circle, the more activity is being reported from
the region.
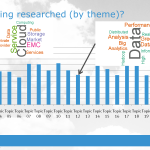
What
types of analysis can be run against a database containing research activities? During my talk I described the current reports enabled by our analytics framework:
- A visualization of the “types” of research
currently active in our portfolio (e.g. solid state storage, analytics, etc). - A visualization of the “types” of research by
region (e.g. where in the world do we research compression technology?) - Who are EMC’s key researchers in any given
region? - Which researchers are the best at transferring
knowledge out of their region? - For any given EMC researcher, what type(s) of
research do they conduct? - What is the complete list of EMC employees, per
region, that are involved in any form of university research? - How can global EMC employees advance their own
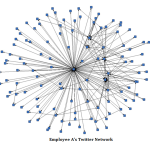
ideas by locating relevant university research? - How do we augment university research with other
external employee connections (e.g. programmatically leverage their Twitter
connections)
The talk was well-received. The faculty and students that
attended got a good feel for the framework that EMC uses to impact our own
business by expanding our knowledge with local university partners.
In future posts I will dive in many of the items above in
more detail to specifically describe how analytics are leveraged to improve
EMC’s university research results.
Steve
EMC Fellow