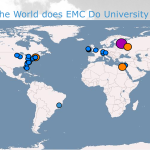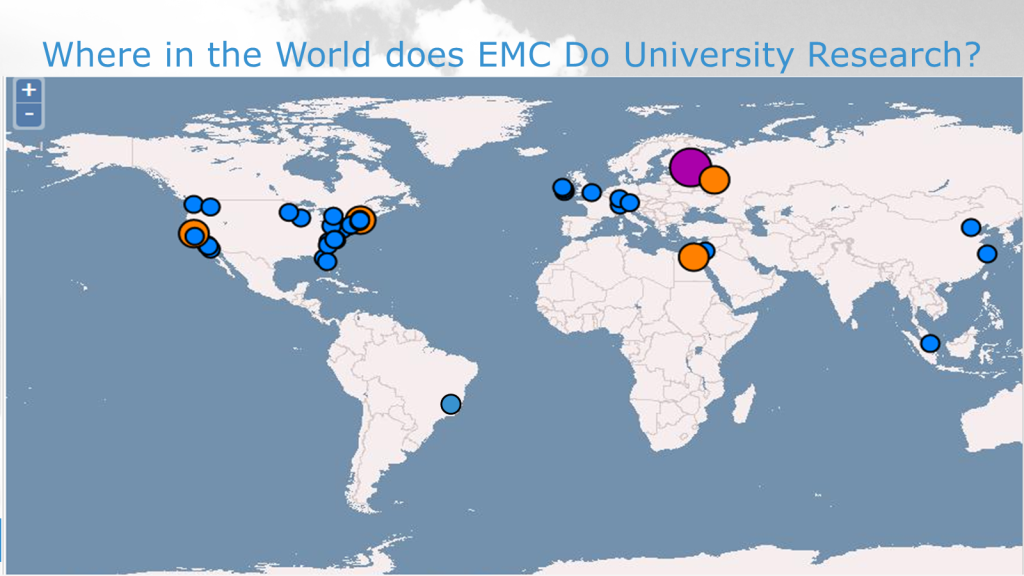
In my last post I used the diagram below to highlight the
locations and activity level with EMC's global university
research partners:

Additionally, I included another graphic which highlighted
that the large purple dot hovering over Saint Petersburg Russia can be further
analyzed to discover examples of research that is occurring in that locale.

Given the capabilities to track and analyze “what” types of
research EMC does, and “where” the research is being conducted, in this post
I’d like to focus on “who” is doing the research. In particular, I’d like to add two regions that also have university
research programs: Europe and China.
If I wanted to plan a conference call with any and all employees that conduct research in Europe or Russia, who would I invite to
the meeting? If I wanted to pinpoint the
employee(s) in China that researches Hadoop with a local university, how could I use analytics to arrive
at an automated answer?
EMC's current approach allows the company to answer these questions. In
my last post I described the analytic sandbox that is used to aggregate research
and innovation activities across EMC. I mentioned that
location information (e.g. the geography where the activity occurred) is
retained. In addition, the employees involved with that activity are imported
as well. This allows reports to be generated that summarize the total number of
employees that are active in university research across multiple locales:

Note that the analytic repository accurately lists myself
(Todd) as a participant in Russian University Research (as evidenced by a previous blog post describing one such visit).
Certainly this capability is useful, but can we dive a bit
deeper? For example, can I find the
Chinese researcher that is most active in researching Big Data Analytics
algorithms with local Chinese universities?
The answer is yes, and the algorithm is as follows:
Jidong Chen is listed as the most active Chinese employee
when it comes to university engagement. The database can be queried to find the
specific entries containing Jidong as a participant. Each of these engagements,
in turn, can be compared against the topic model described in the visualization blog
post. Each activity can be mapped into one of the 25 buckets. For example,
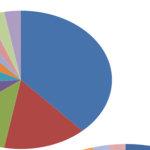
Jidong’s last five activities are mapped as follows:

This graph shows that 80% of Jidong’s activity map to “Big
Data”, and one of them maps to “Cloud”.
A deeper historical analysis of all of Jidong’s activity would reinforce
his research leanings.
This approach proves that the “voice” or “research interests” of any EMC
employee can be discovered using analytic techniques.
The next question to ask would be: “does this employee
collaborate outside of their geography”?
I will answer this question in my next post.
Steve
EMC Fellow