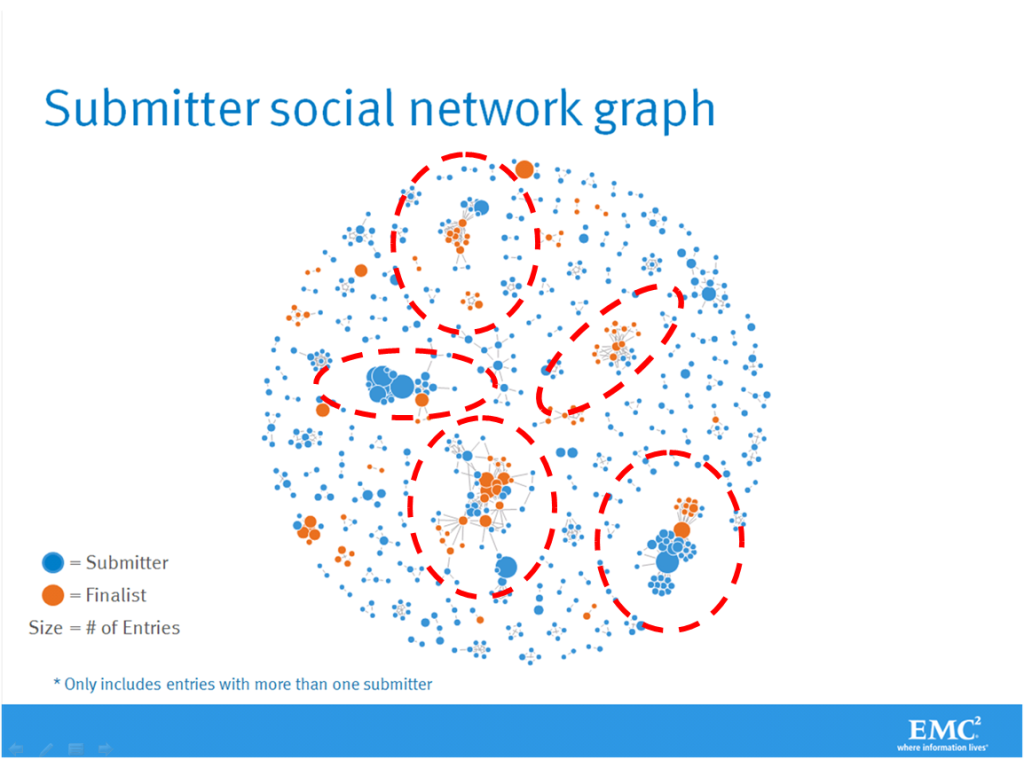
In my corporation (EMC) we are currently running a global idea conference (the annual Innovation Showcase) that has generated 1,590 unique ideas. I’ve written several posts about our use of analytics to gain further insight into how EMCers innovate. In particular, we use social network analysis (SNA) to determine if we have passionate clusters of inventors.
I look at the chart below and wonder to myself: “Who are these people”?

As the Director of EMC’s Innovation Network, the employees that cluster together to submit ideas into our Innovation Showcase are a mystery to me. The tool that generates this chart has informed me that there is a high-correlation between having your idea chosen as a finalist and having a strong social network. However, I don’t know their names, I don’t know who they are friends with, I don’t know where they sit, and most importantly, I don’t know what they are talking about!
In short, I don’t know much! But I plan on finding out.
And I’m getting some help from a local university.
Believe it or not, the process of analyzing a corporate social map for influential innovators is a growing area of research.
It’s called Coolhunting.
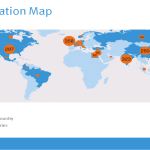
Last week, my innovation team and I hosted a day-long summit at the MIT Media Lab in Cambridge, Massachusetts. We invited top technologists from all of our global R&D locations in Ireland, Russia, Israel, China, Egypt, and Cairo. We also invited those EMC Fellows and Distinguished Engineers that have displayed a passion for international innovation. MIT Data Scientist Sandy Pentland spoke to us about innovation in the context of human behavior. MIT Research Scientist George Westerman discussed “Six S Incubation”, a corporate framework for significantly accelerating incubation within a company. UMASS Boston Professor Duc Tran discussed Socially-Aware Storage Systems.
The Professor with the most relevance to my problem, however, was MIT Professor Peter Gloor. Peter is a co-author of the book “Coolhunting: Chasing Down the Next Big Thing“. To quote from Peter’s book:
“We have been able to discover social group networking structures that are indicative of high performance or high creativity.“
Coolhunting is about finding those innovators that play a central role in the corporate innovation ecosystem. Peter argues that if you have an accurate social graph, the job of coolhunting is a matter of simple math.
As part of my job I oversee quite a bit of university research. Most of it is related to advancements in computer science and/or high-tech capabilities. Our research topic with the MIT Media Lab, however, is focused on how we innovate as a corporation. The research that we have brought into the company via this partnership is starting to have a fairly profound impact.
For the Coolhunting research, the hardest part is the generation of the social graph. Most companies don’t have one.
In our case, we do (I’d be happy to share how we generate ours).
So the question remains: Who are these people?
You and I are about to find out.
Steve Todd
Twitter: @SteveTodd
Director, EMC Innovation Network
Steve, interesting stuff! I program manager of our company’s internal, global R&D program. Was wondering what you used to generate the SNA graph in this post.
Thank you!
Mary Lou
Hi Mary Lou,
I’m responsible for the analytics that Steve has been sharing. To generate the SNA graph, I used R’s igraph package.
http://cran.r-project.org/web/packages/igraph/index.html
The package has a learning curve but has been very useful in analyzing the Innovation Contest’s social network. Be on the lookout for more SNA related posts by Steve.