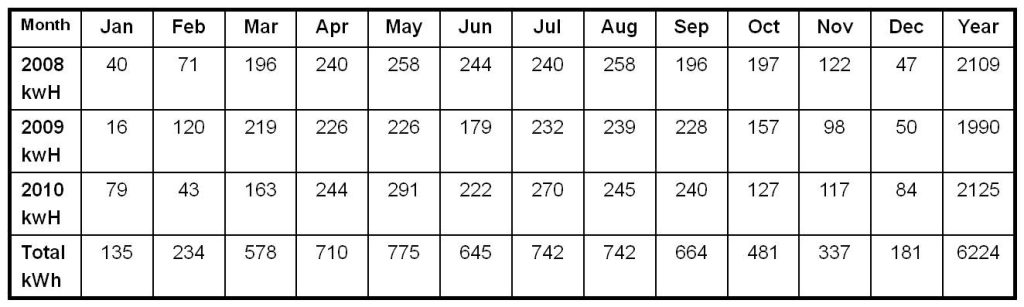
Posted below are the 2008-2010 kwH stats for the solar panels on my roof. The three years of statistics begin to reveal some trends. In general, the sun is generating about 25-30% of the electricity needs of my home.
The record amount for the month of May (as well as for the year) can be attributed to a VERY sunny spring with little rainfall (all the lawns in the neighborhood were fairly brown as the summer wore on).

The three year total of 6224 kwH is not too shabby!
Steve
Twitter: @SteveTodd

Thanks for the data Steve. I see a 6:1 variance between your min and max output in a typical year. Looking at my consumption I see at most a 3:1 variance in a year, typically closer to 2:1. Your annual output would help me avoid one month’s consumption in summer when the temperature is highest and the AC is working overtime. We really need Moore’s law to drive the efficiency of this technology higher.
Not too shabby. That comes out to what, about 30 bucks a month saved on average?
30 bucks/month more or less. Rates have gone up 3 times since I installed the panels, so the number is constantly changing.
Wow interesting chart. Thanks for that data. I was planning to install a solar panel at home to help reduce the bill. Uncle had it already and really got a good result upon energy consumption. Thanks for sharing some ideas. I love your idea.