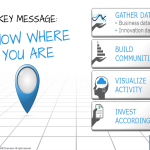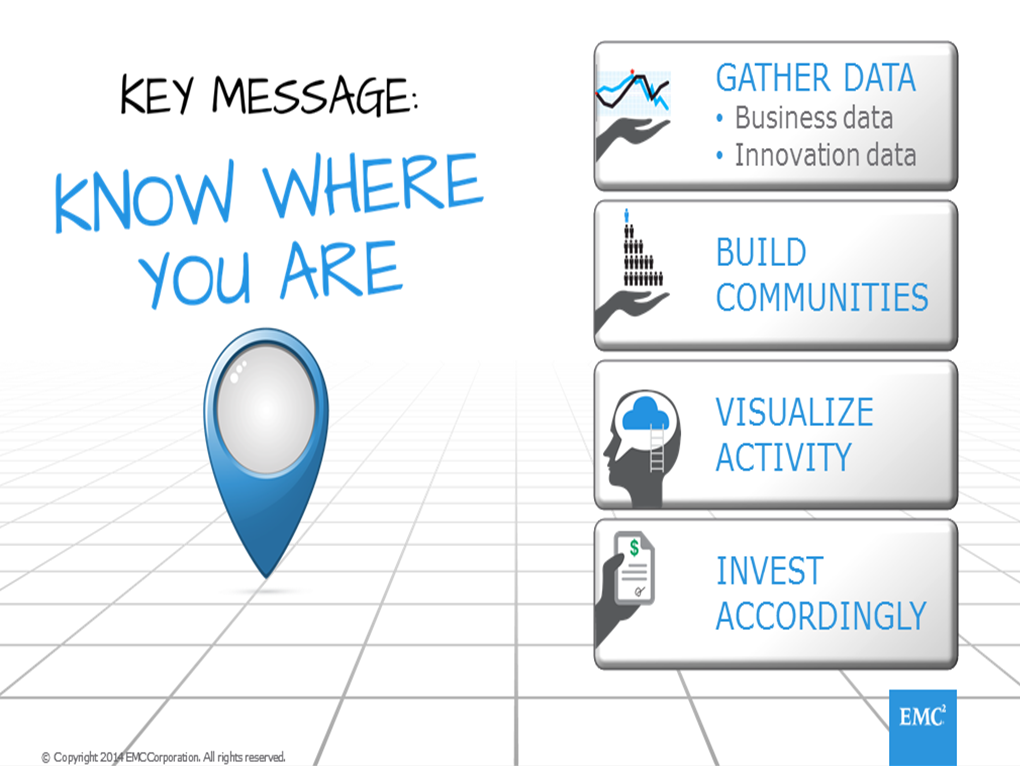
I’ve been delivering a series of posts that describe the approach that my company (EMC) is taking to guide innovation investment strategies. This approach is called Know Where You Are. In this final post I’d like to touch on the fourth tenet: Invest Accordingly.

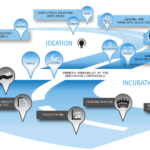
The diagram below highlights a data-driven innovation approach that leverages the concepts I have introduced in previous posts. The data gathered from the portfolio intelligence team, the innovation communities, and the visualizations are presented to the highest executives in the company.

EMC’s Portfolio Intelligence team, in addition to gathering business data, also sponsors a monthly meeting with corporate executives (known internally as the Product Strategy Forum, or PSF). This meeting educates executives on EMC’s technology direction and innovation activity as compared to market directions.
The PSF will gather and review innovation data on a quarterly basis. The executives receive an overview of the business and innovation data (gathered from EMC’s innovation communities) and discuss the meaning of the visualizations. During these discussions the executives have the opportunity to ask questions and make decisions on appropriate innovation investment levels. The diagram below highlights a desired outcome of these meetings.

The Portfolio intelligence team has gathered internal business data on EMC’s products as well as external data on emerging technologies/markets. The innovation visualizations have identified advanced development and research projects that span the product life cycle. The amount of people and resources being spent on these projects result in a sum total of innovation spend, and the categorization of that spend can be broken down into percentages for mature, growth, and emerging products.
For example, this type of visualization allows the company to make conclusive statements such as:
- We are spending X million dollars on innovation
- A% of that innovation spend is going towards mature products with CAGRs that fall below a specific threshold
- B% of that innovation spend is going towards growing products with CAGRs that fall above that threshold
- C% of that innovation spend is going towards emerging technologies where the CAGRs are essentially infinite or unknown.
With this data in hand, companies can now decide what level of investment to make, e.g. 10-80-10, or 5-70-25.
This approach of data gathering, visualization, and innovation decision making seems obvious but is oft-neglected. Perhaps this is why the CTO of EMC often says “If you don’t know where you are, don’t even bother having an innovation strategy.
Although this is the last post in which I specifically lay out the basic tenets of the EMC strategy, in my mind there are two follow-on threads that I am interested in exploring:
- For EMC’s customers (current or potential), we have created a program where they can visit EMC for the sole purpose of sharing their own innovation structure, comparing it to ours, and then attending an innovation tour with one of our local innovation partners (e.g. incubators like Mass Challenge and researchers such as MIT Media Lab and MIT CSAIL). This innovation tour is actually a formal offering available via our Executive Briefing Centers.
- I’d like to explore the category of “emerging” and share a bit more detail of what technologies EMC views as emerging and highlight some of our innovation activities in those areas.